Consultation with Churches, Colleges and Associations
Contents of this page:
Introduction to this chapter
In this chapter we present the results and analysis of the survey of churches, colleges and associations.
52% of churches, colleges and associations responded to this survey, this is a good level of response in comparison to similar surveys.
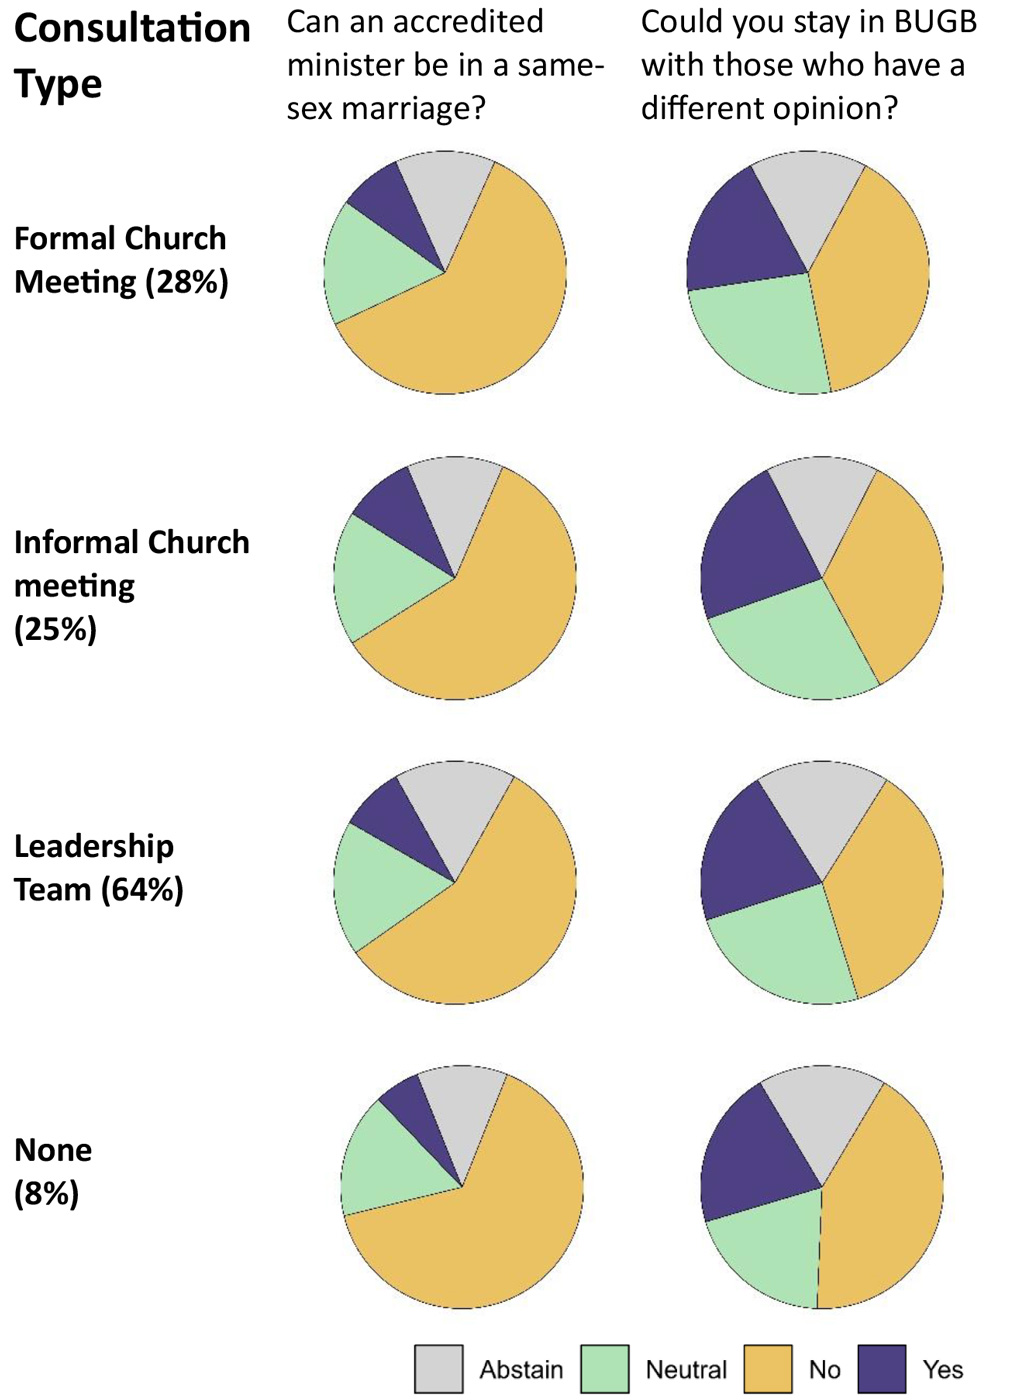
The person completing the survey was asked to indicate what their role in the church or organisation was. They were also asked if they were completing the survey following consultation with others. For this question they were given a range of options to select. It is worth noting that only 8.3% of churches and other organisations responding to the survey said they had not consulted with others and were offering their own perspectives of the view of their church or organisation. 66.3% had consulted with the leadership team, 28.7% had an informal church meeting and 26.4% had a formal church meeting, 26.3% of the people completing the survey for their organisation had consulted with the minister. It was possible for respondents to select more than one of these categories, for example, a church who had a formal church meeting might also have had an informal church meeting, churches might have consulted with the leadership team having also had an informal church meeting.
Please note that 98.5% of those who completed this survey were churches. The other 1.5% were Associations and Colleges. The majority of Associations and Colleges abstained from answering these questions. There is no data available that helps us understand why this might be. It may be because they didn’t feel able to answer on behalf of their Association or college. There may be other reasons. Furthermore, because this group is small, for simplicity, we will talk about ‘churches’ in this Report.
In this chapter we analyse responses to the following survey questions:
-
How strongly does your church think/feel that a minister should be accredited by the Baptist Union of Great Britain if they are in a same-sex marriage?
-
If the Ministerial Rules were changed, could your church continue to belong to the Baptist Union of Great Britain alongside churches who think differently about this matter?
Churches, Associations and Colleges were asked about the effect of keeping or removing the bracketed section of MR Rules, Appendix 3, Section 4.3 on the life of their church. The question asked about the effect of each of these options on both the missional (outside the church) and pastoral (within the church) life of the church.
Who took part?
943 organisations took part in the Consultation, 52% of the possible 1,824.
If the churches, colleges and associations who responded were a village of 100 buildings…*
-
69 would have, or be looking for, an accredited minister, 16 would not have a minister, and 9 would have a minister who is not accredited with the BUGB.
-
53 would have a roughly equal gender split, 33 have more women, 2 have other genders, 1 has more men.
-
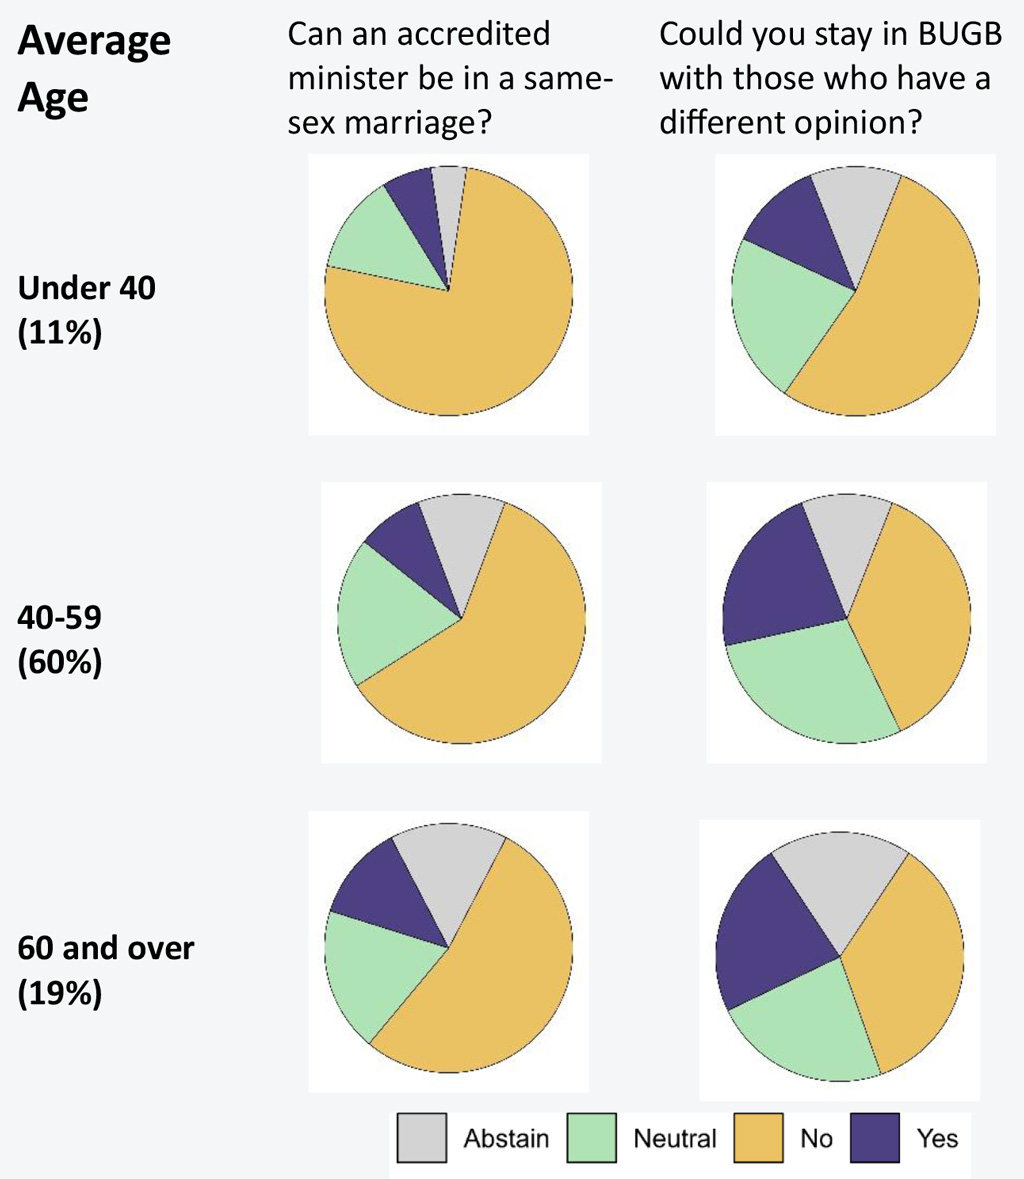
11 would have an average age less than 40, 60 between 40 and 59, 19 would have 60 and over.
-
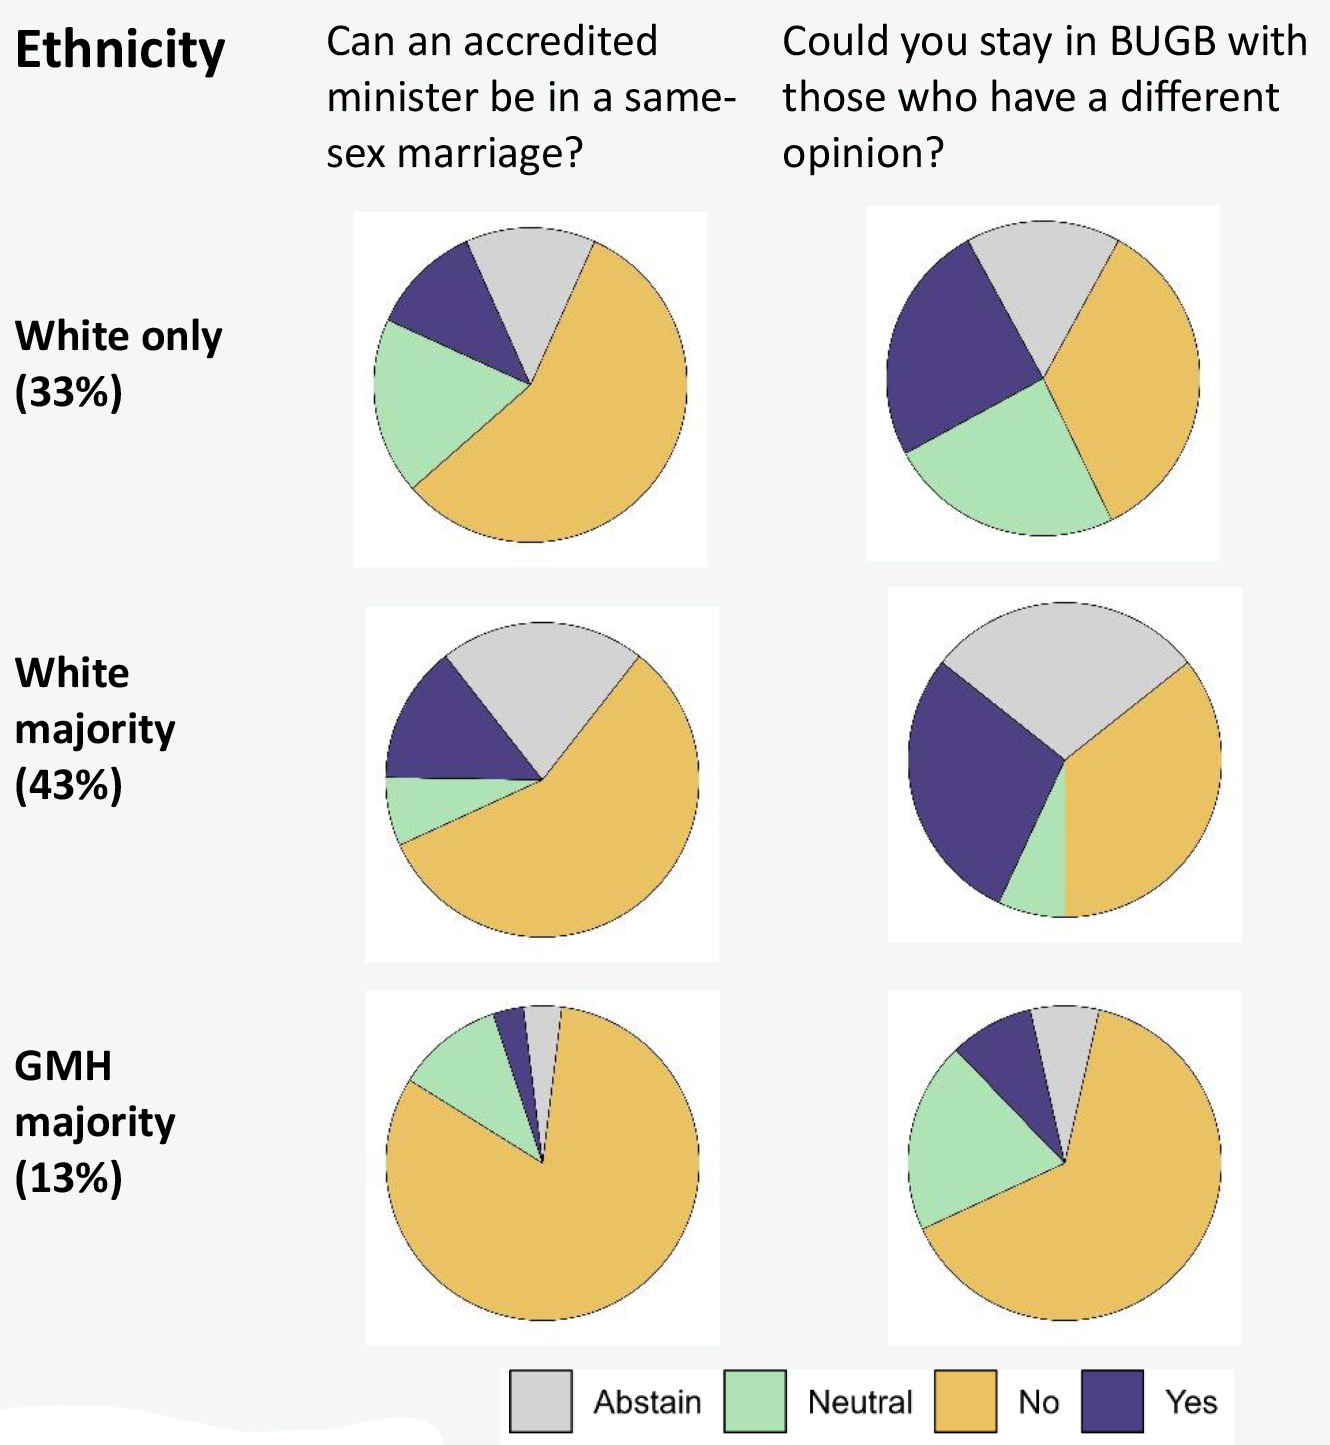
33 would be made up of only white people, 43 would be majority white churches, and 13 would have a majority of people of Global Majority Heritage.
-
13 would be in deprived areas, 17 in areas with very little deprivation, 51 in the middle.
-
16 would be in rural areas, 66 in urban ones.
-
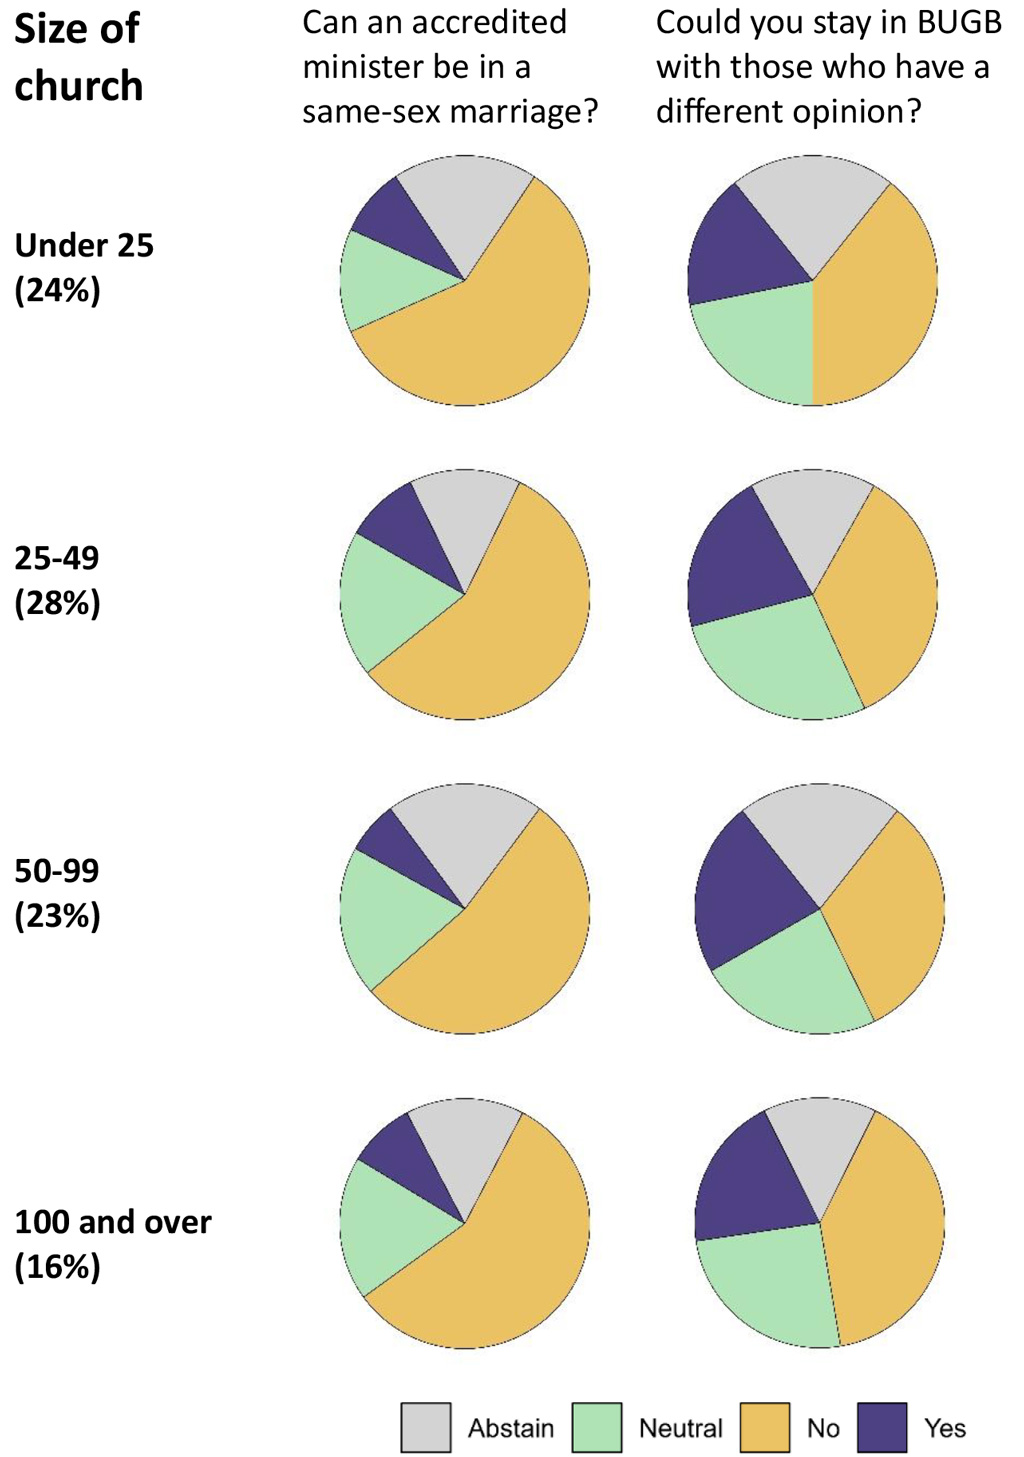
24 would have fewer than 25 members, 28 between 25 and 49 members, 23 between 50 and 99, and 16 would have 100 or more members.
-
28 would have held formal church meetings; 25 held informal meetings, 8 gave only the respondent’s view of the church.
-
98.5 of the buildings in the village would be churches, 0.4 of a building would be colleges and 1 building would be associations.
* Please note that not all categories from the survey are listed here and not all respondents answered these questions, therefore these totals may not add up to 100.
Return to top of page
Questions about Accreditation and Same-Sex Marriage
In this section we present the responses of churches, Associations and Colleges to these two questions:
-
How strongly does your church think/feel that a minister should be accredited by the Baptist Union of Great Britain if they are in a same-sex marriage?
-
If the Ministerial Rules were changed, could your church continue to belong to the Baptist Union of Great Britain alongside churches who think differently about this matter?
On the information that follows we look at these responses through a number of different lenses, for example what category of minister a church has (accredited/non-accredited/vacancy), the ethnicity, age or gender profile of the churches, their geographical and economic context, etc. We explore what this approach to the data reveals about the responses to these questions. To what extent do the demographic and other characteristics affect the response to the questions? We also explore what, if any, differences there are in the responses for different forms of consultation prior to completing the survey, including informal/formal church meetings.
The survey questions asked people to respond to the two questions above on a sliding scale, from ‘absolutely not’ to ‘definitely yes’. The position selected on the sliding scale was matched with a numerical score, from 0 for ‘absolutely not’, to 10 for ‘definitely yes’. In the pie charts that follow we have aggregated the scores to give three categories: 0-2 is ‘no’, 3-7 is ‘neutral’ and 8-10 is ‘yes’. For completion, we have also shown the number of abstentions.
If you are interested to
look in more detail at the data, see the Appendices.
What did they say?
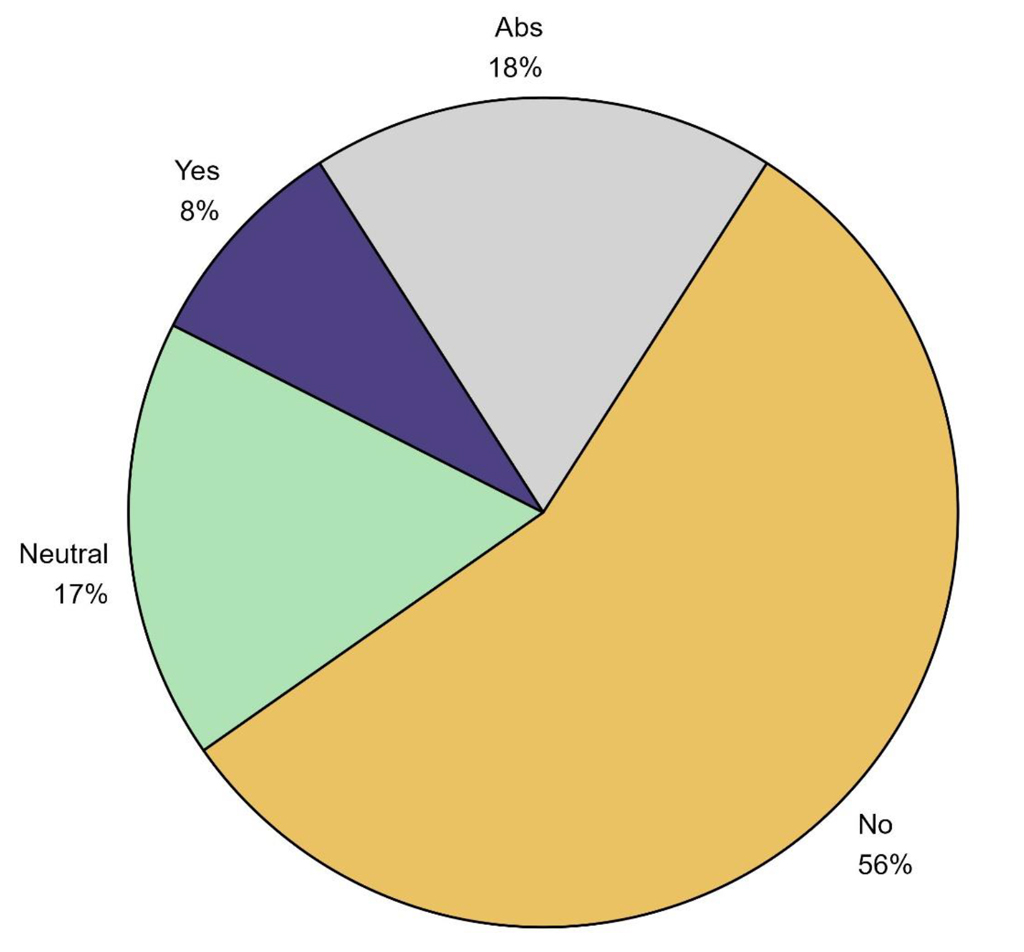
How strongly does your church think/feel that a minister should be accredited by the Baptist Union of Great Britain if they are in a same-sex marriage?
|
|
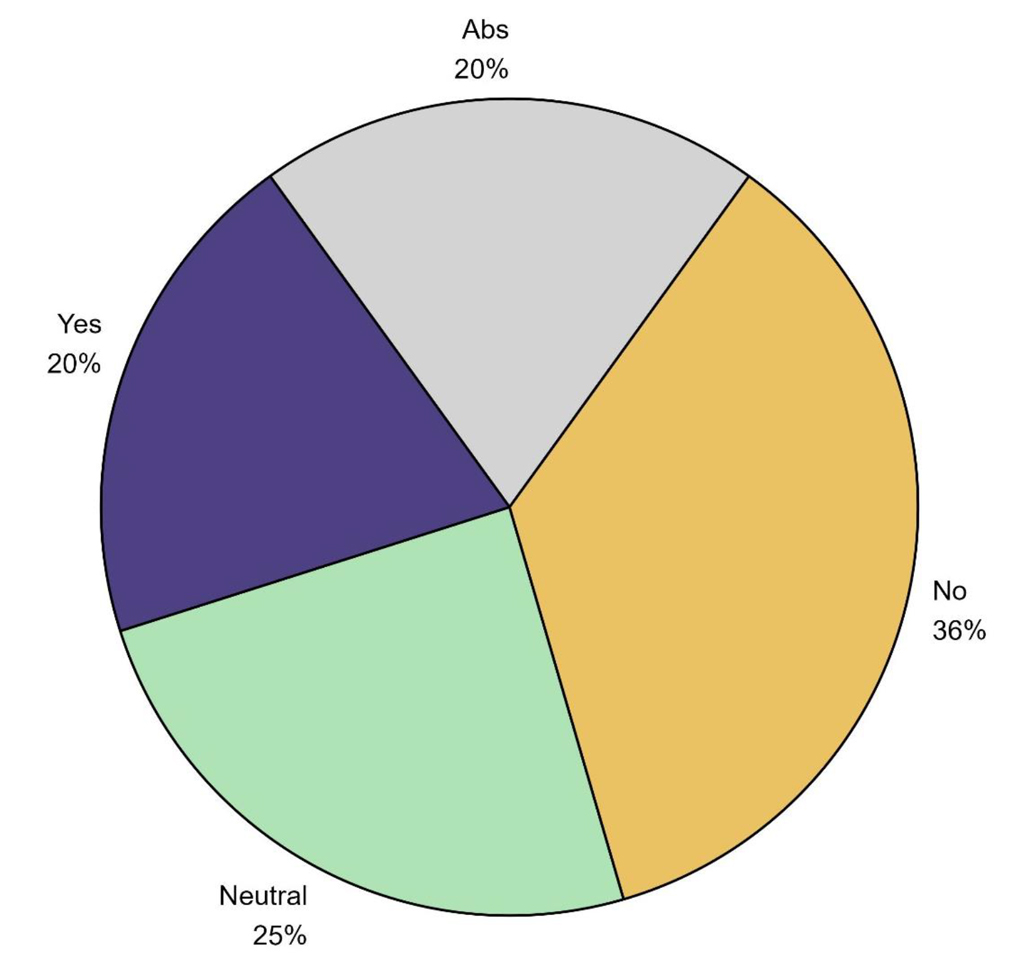
If the Ministerial Rules were changed, could your church continue to belong to BUGB alongside churches who think differently about this matter?
|
 |
|
 |
56% of those who responded said that an accredited minister could not be in a same-sex marriage; 8% said they could be. 17% were neutral and 18% abstained. |
|
36% of those who responded said that they could not stay in covenant with those who have a different opinion; 20% said they could stay. 25% were neutral and 20% abstained.
|
Headlines from these charts
56% of those who responded to these questions said that an accredited minister could not be in a same-sex marriage and 36% of those who responded said they could not stay in BUGB with those who have a different view. Although the number saying ‘yes’ to the first question is only 8%, the number who could stay in relationship with others who have a different view is 20%. It is possible that a small proportion of those who said ‘no’ to the first question have said ‘yes’ to the second.
It is of interest to note that 17% of responses were neutral regarding the first question and 25% in the second. It is also of interest to note that the abstention rate is high for these questions, 18% of respondents abstained from answering the first question and 20% in the second question. We will explore the neutral responses and abstentions further, before looking at the data in the charts in more detail.
A note about abstentions
18% of those who responded to the first question abstained from giving a response. Similarly, 20% abstained from the second question. This is a high level of abstentions. It is noteworthy that it is higher than in the ministers’ survey (4% of ministers abstained from answering the first question and 6% from the second question). It may be helpful to note that during the MR Rules Consultation, churches were encouraged to participate in the survey even if they didn’t complete it. They were invited to add a comment at the end in response to the question: ‘Is there anything else you would like us to hear about your church’s views on these matters?
We have analysed these final comments and identified some reasons why responses to questions in the survey were not given.
Some of the reasons given for abstaining, were:
-
Concern about the impact on the churches, with a particular concern about division:
“[The] deaconate decided not to participate – divisive, focus on maintaining the church unity, we’ve seen it divide other churches.”
“Our biggest concern as a small church is that we do not have the resilience for this to become a divisive issue within the congregation.”
“The matter is too contentious for further discussion with the Church membership.”
-
The church was or has recently been in vacancy:
“We have discussed this as a deaconate and agreed that as we are currently without a minister, we do not feel we can comment on this at the moment.”
“The leadership has elected to wait for the new minister before tackling this subject.”
“I am a new minister (a few) months in and the church has not engaged with the issues up to now.”
-
Other matters were taking time and energy:
“Because other significant issues have taken our focus during the last few years, we’re not able to engage our fellowship with this topic/consultation directly.”
“There has not been time this year amidst other things that were already in our calendar.”
-
The church had not engaged with discussions about human sexuality, but intended to do so in the future:
“We decided we needed to be better informed and so agreed to establish a wider exploration into matters of sexuality.”
“We didn’t feel ready to respond on behalf of the Trustees or the Church as a whole at this point as, in many ways, the consultation has come a year too early for us.”
“As a church we are not ready to present a collective view, but we are beginning the journey exploring issues together in the New Year.”
A note about neutral responses
It is also worth noting that the neutral responses (scores of 3-7) are reasonably high as a proportion of all responses. 17% of those who responded to the first question gave a neutral answer. 25% gave a neutral answer to the second question. There may be a variety of reasons why respondents select a space somewhere in the middle of the scale: people within their church may hold a range of views; the respondent may be unclear what view or views the church holds; they may be unconcerned as a church about these questions. We identified comments from the final comment boxes in the survey which may offer some reasons for a ‘neutral’ response.
“Neutral = Range of opinions, not settled yet.”
“There are a variety of opinions in our leadership team and the church.”
“We know we hold a spectrum of views on this issue of sexuality and marriage within the church and this was expressed through the leadership decision.”
“We are aware that views and opinions are as diverse as the people within the church. Despite the complexity of the underlying issues here, we shall seek to balance views and not allow them to divide us.”
A note about those who did not participate.
As mentioned above, a 56% response rate for the Churches, Association and Colleges Survey is a very good response rate. It does however mean that 44% of those invited did not participate in the survey. They are silent in the survey.
There may be a variety of reasons for this silence. They may be indifferent to the survey and/or the questions; they may not have believed in the process; they may have not got round to responding or been too busy to do so. Perhaps they didn’t get an email invitation to the survey; or they didn’t see it; perhaps they didn’t know what the consultation was. Perhaps they do not believe that a national church should have a view on anything that relates to the local church and therefore they decided not to participate because of the importance of their Baptist identity. As we don’t have any data from these churches, it is impossible to know from the survey why they are silent in the consultation. We cannot assume we know. It is also impossible to know what those who are silent in the consultation would have said. Any assumptions would be unsubstantiated with data. It is important to notice them and to acknowledge their silence.
We will look at the responses to the two questions about accredited ministers and same-sex marriage and about staying in BUGB alongside those with a different view, through a variety of lenses. The purpose of this approach to the data is to identify what, if any, differences there are in the responses, depending on the age, ethnicity or gender profile of the church; depending on the geographical or economic context of the church. We will also analyse the data to see if there is any difference in responses from churches with an accredited, a non-accredited minister or in vacancy; from churches who have not consulted, and from churches who have consulted informally or formally through a church meeting. This ‘demographic’ information was gathered from participants at the beginning of the survey. Occasionally the person completing the survey did not complete all these ‘demographic’ questions, however almost all did, and it is therefore useful when analysing the responses.
Who said what?
 |
|
 |
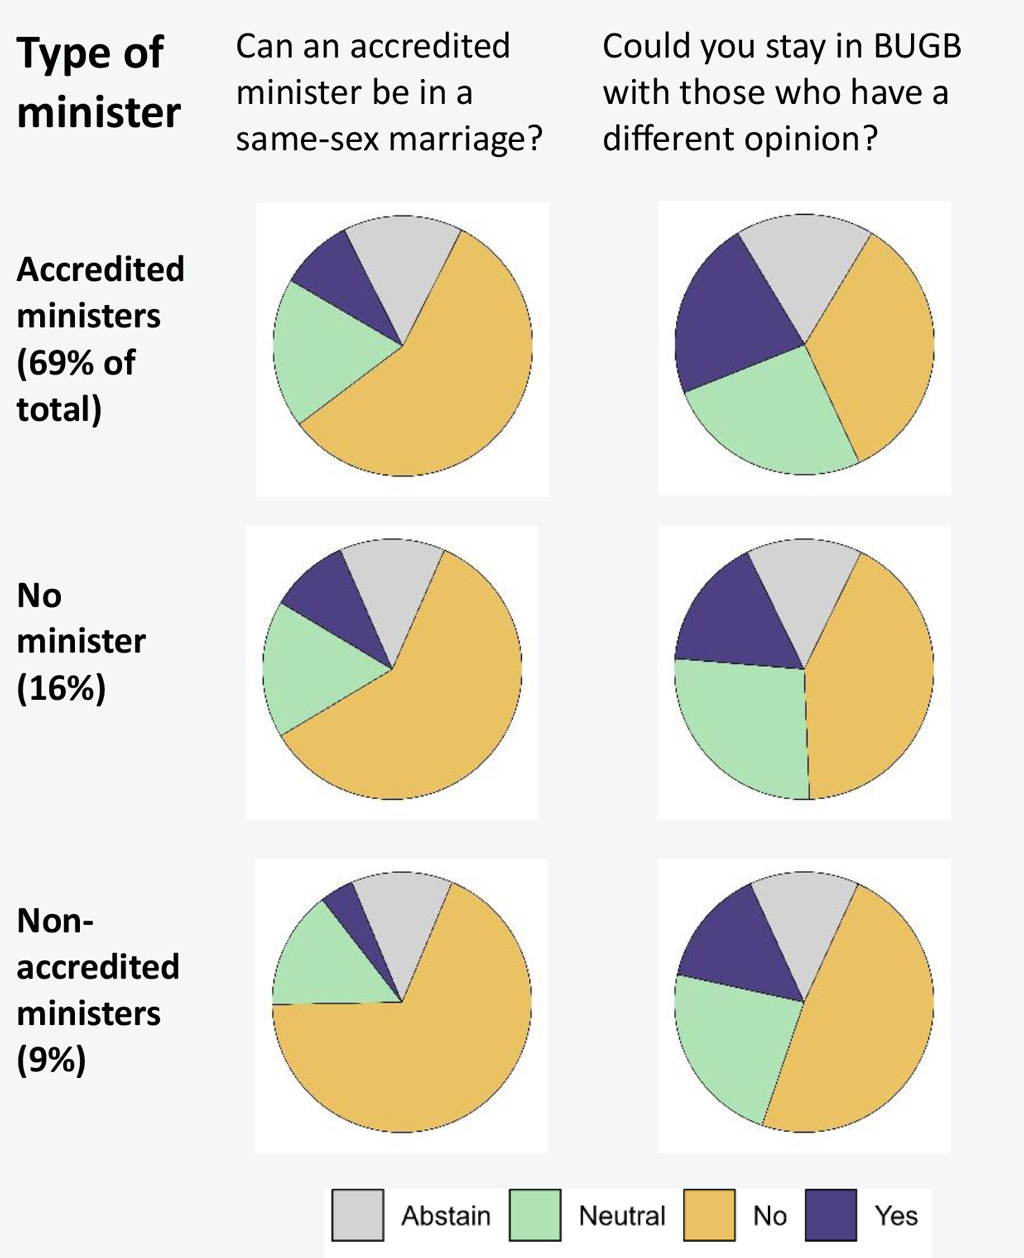
57% of churches with ministers accredited by BUGB felt that an accredited minister could not be in a same-sex marriage; the figure was higher in churches with no minister and highest (71%) in churches with non-accredited ministers.
|
|
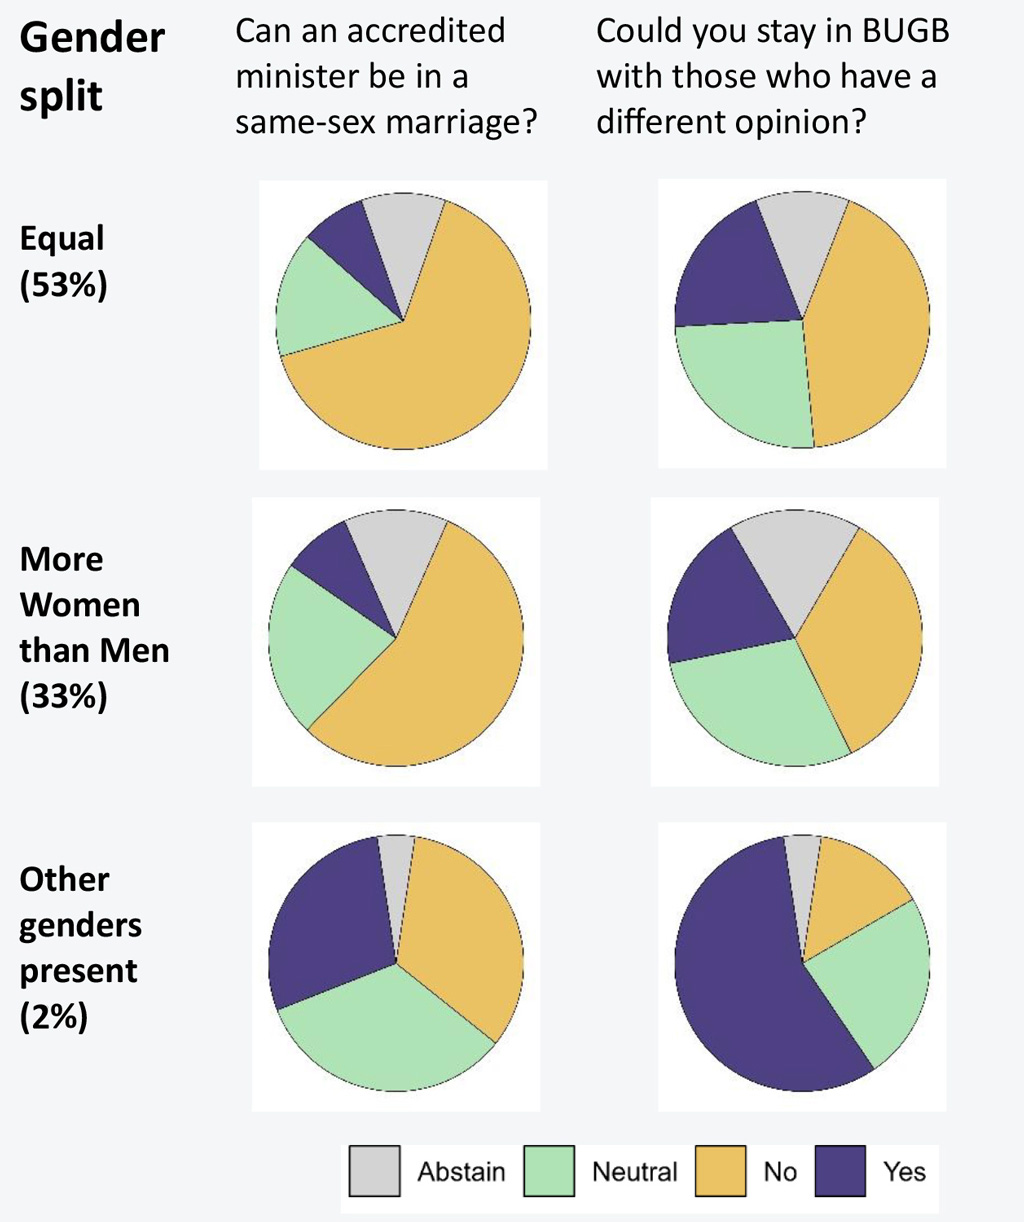
65% of churches with an equal (40-60% M/F) gender split felt that an accredited minister could not be in a same-sex marriage; the figure was lower in churches with more women. 2% of churches reported other genders in the churches, of those 29% felt that an accredited minister could be in a same-sex marriage. Only 6 (0.6%) churches reported having more than 60% men. Note: responses from fewer than 10 churches are redacted for their privacy. |
|
|
|
|
|
|
|
|
 |
|
 |
Churches with an average age under 40 are most likely to believe that accredited ministers could not be in a same-sex marriage (76%) compared with 53% of those with an average age of 60 and over. Similarly, they are least likely to stay in BUGB with those of a different opinion (54%) in comparison with other churches with an older average age.
|
|
82% of churches with a majority of people of Global Majority Heritage (GMH) felt that accredited ministers could not be in a same-sex marriage in comparison with 57% of other churches. Only 9% of GMH majority churches could remain in BUGB with those of a different opinion. One church had a majority of Asian/Asian British people and nine had a majority of those of Mixed/Multiple ethnicities. 50 had majority Black/Black British people.
|
|
|
|
|
|
|
|
|
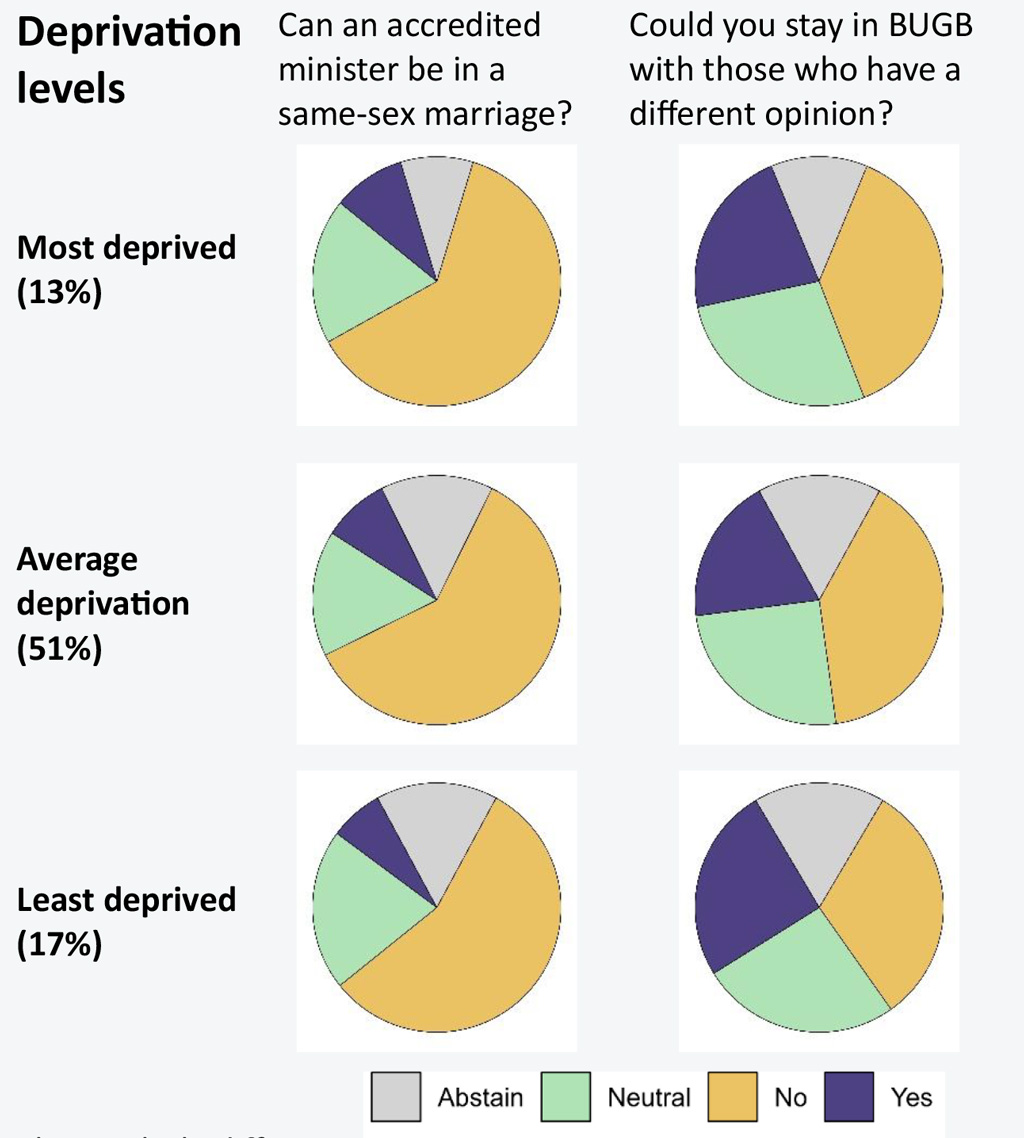
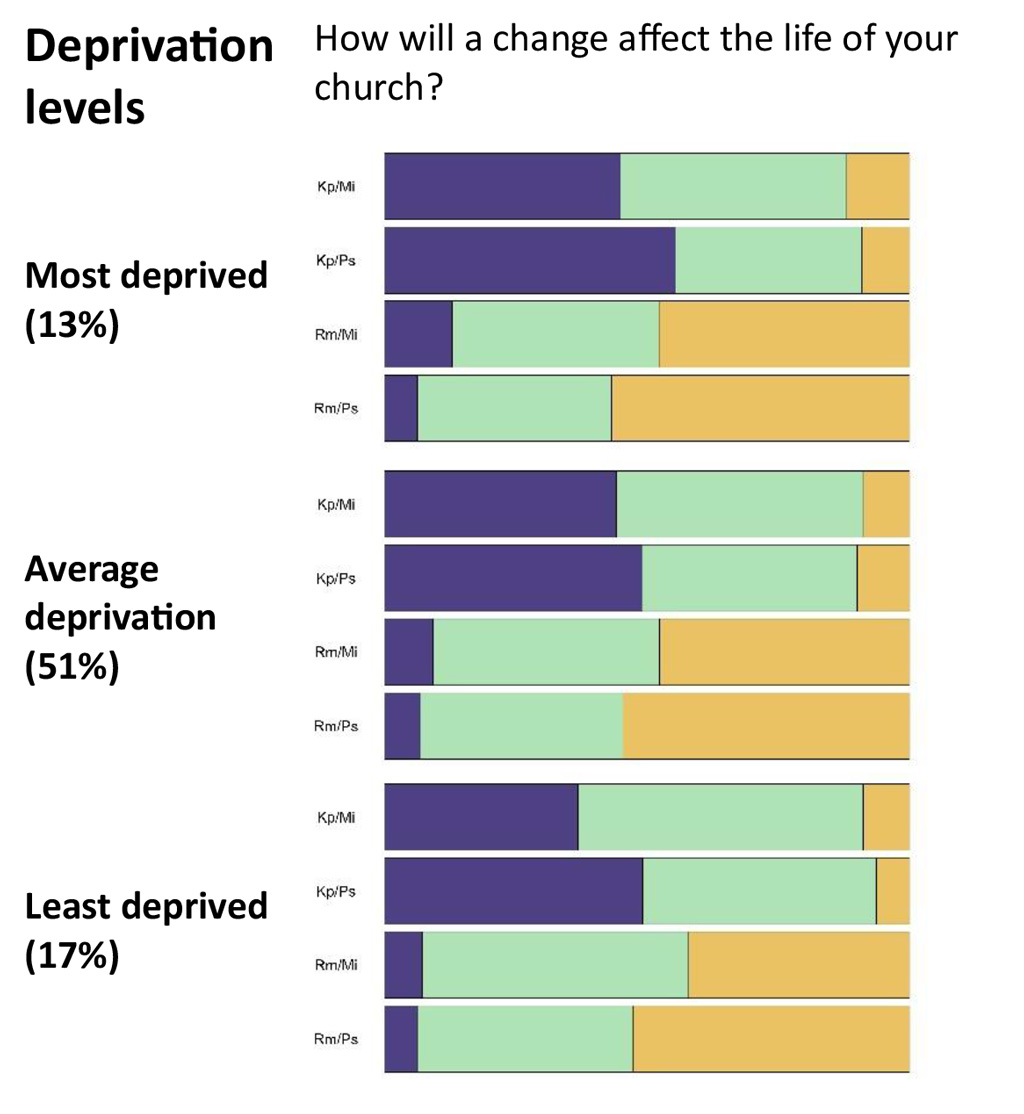
There is little difference between the views of churches located in areas of different deprivation (as defined by the Index of Multiple Deprivation). 62% of those in the most deprived areas feel that an accredited minister could not be in a same-sex marriage, compared with 56% of those in the least deprived areas. 38% of churches in most deprived areas could not stay in BUGB with those of a different view, 32% in least deprived areas. |
|
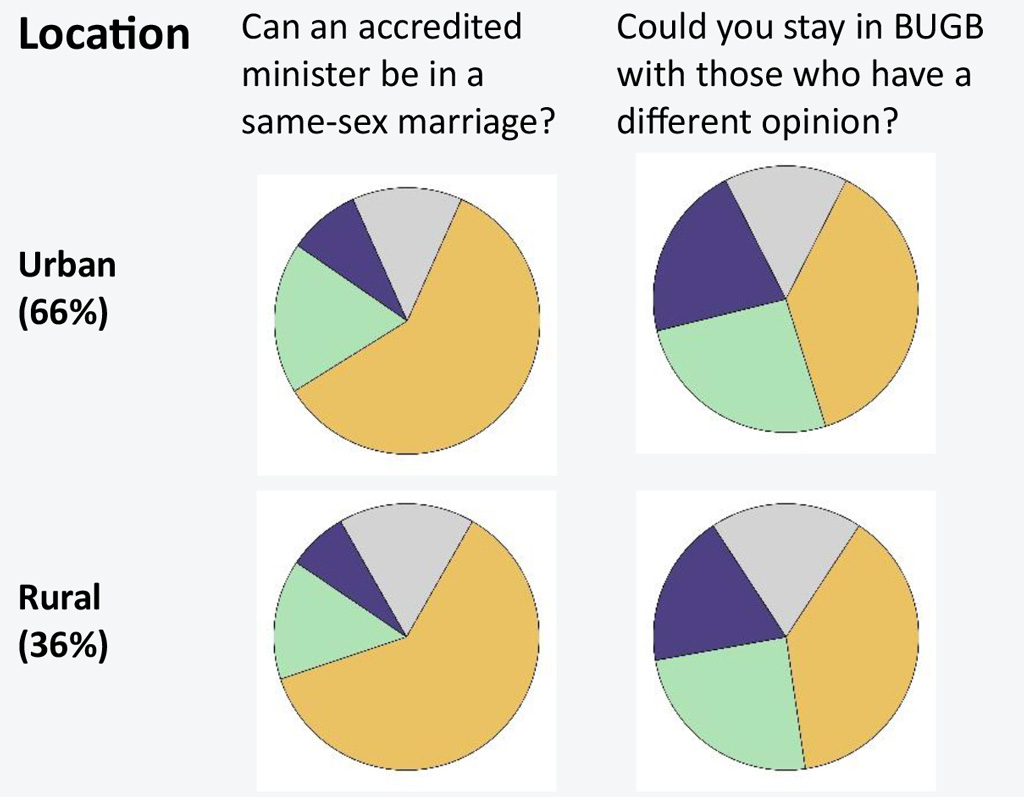
There is little difference between responses from churches in urban and rural locations (as defined by DEFRA).
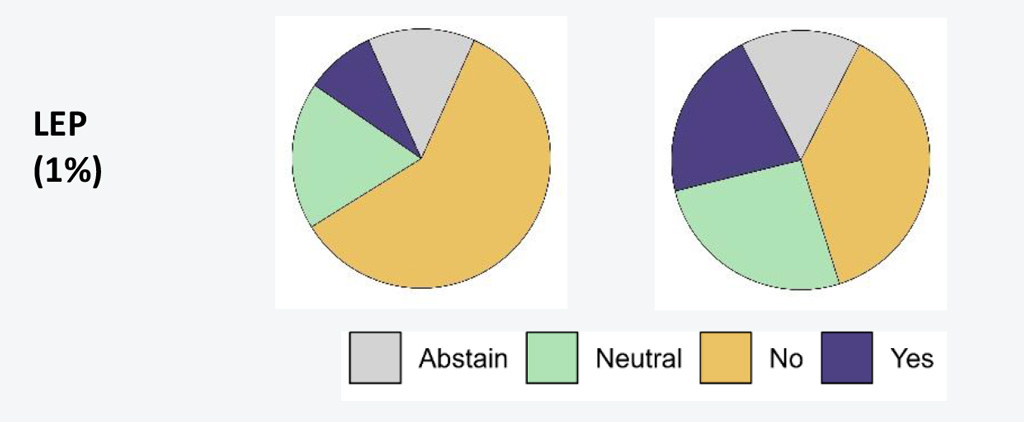
There is also little difference in responses from churches in Local Ecumenical Partnerships (LEP). |
|
|
|
|
|
|
|
|
 |
|
 |
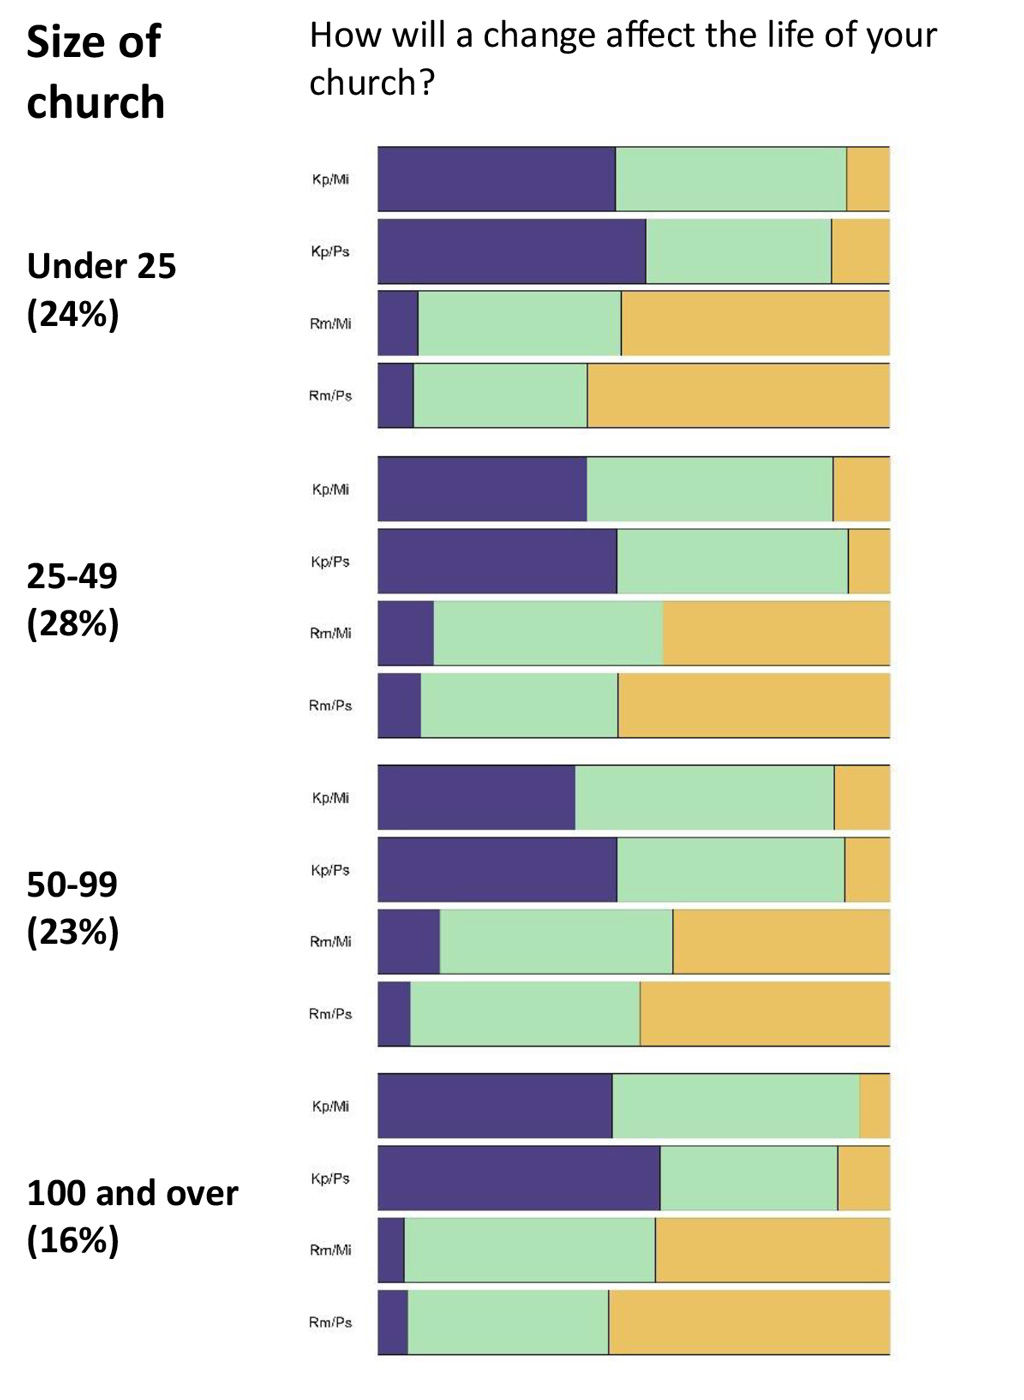
There is little difference in the views of churches of different sizes.
|
|
There is little difference in the views of churches who used different consultation methods.
|
Headlines from these charts
56% of those who responded to these questions said that an accredited minister could not be in a same-sex marriage and 36% of those who responded said they could not stay in BUGB with those who have a different view. This is reflected in the responses from churches with an accredited minister (57% to the first question and 34% to the second question). However, there is a marked difference in the responses from churches with a non-accredited minister (71% for the first question and 52% for the second).
76% of churches with an average age of less than 40 say ‘no’ to accreditation of ministers in same-sex marriages. Furthermore, the majority (54%) of these churches could not stay in relationship with churches who hold a different view. A majority (53%) of churches with an average age of over 60 say ‘no’ to accreditation of ministers in same-sex marriages, a third (35%) could not stay in BUGB with those who hold a different view. Over a third (37%) of churches with an average age between 40-59 could not stay in BUGB with those who have a different view.
Global Majority Heritage (GMH) majority churches are considerably more likely than other churches to say ‘no’ to a minister in a same-sex marriage being accredited for ministry (82% said ‘no’, 57% white majority, 57% white). They are also considerably more likely to say they could not stay in BUGB with those who hold a different view (65% said ‘no’, 33% white majority, 35% white). The number of GMH majority churches who participated in the survey is about 13% of total respondents. There is very little mention in the final comments boxes that might inform the data in the pie charts. However, a number of people who participated in the Baptist Assembly Listening Space expressed concern for GMH majority churches, with regard to these questions.
This concern was two-fold:
-
Churches who are majority GMH will tend to read from the Bible that marriage is between a man and a woman and that homosexuality is a sin, leading to a concern that they may leave their church/BUGB should the MR Rules change.
-
GMH majority churches who have chosen to affiliate with BUGB, may not stay affiliated if the bracketed section is removed. Concern was expressed about which other denomination they could affiliate with, recognising they had chosen BUGB because of a sense of belonging.
It is interesting to note that the context of the church, whether that be by measurement of deprivation or by rural/urban setting, makes little difference to the responses to either question. For example, 59% of urban churches feel that accredited ministers could not be in same-sex marriages, in comparison to 62% in rural areas. 21% of churches in urban areas could stay in BUGB with those of another view, 19% of rural churches. It is interesting to note that the size of the church also makes little difference to the responses to the two questions. Furthermore, the differences between churches who have undertaken different methods of consultation, or none, also varies very little.
Broadly, the pie charts that analyse the responses to the two questions (about accreditation and about covenant relationship) differ little from the collective responses presented at the start of this chapter. There are small and important differences, but it is striking how much similarity there is.
If you want to look at this survey data in more detail, it is in the Appendices.
Return to top of page
Questions about the effect of removing or retaining the bracketed section on missional and pastoral life.
This survey asked about the effect of keeping or removing the bracketed section of MR Rules, Appendix 3, Section 4.3 on the pastoral (within the church) and missional (beyond the church) life of the church.
The questions were:
-
In your context, if BUGB were to decide to retain the section in brackets, what effect would this have on the missional life of your church?
-
In your context, if BUGB were to decide to retain the section in brackets, what effect would this have on the pastoral life of your church?
-
In your context, if BUGB were to decide to remove the section in brackets, what effect would this have on the missional life of your church?
-
In your context, if BUGB were to decide to remove the section in brackets, what effect would this have on the pastoral life of your church??
In this section we present the responses.
The results are shown in bar charts to reflect the sliding scale from ‘very positive’ to ‘very negative’.
We have presented the ‘keep’ the bracketed section results first, looking at the effect on the church’s missional life and then looking at the effect on their pastoral life.
Then we have presented the ‘remove’ the bracketed section, looking at the effect on the missional life of the church and then on the pastoral life.
For clarity, the percentages shown on the charts do not include abstentions. They make up around 23% of church responses.
What did they say?
Churches were asked about the effect of
keeping or
removing the bracketed section of MR Appendix 3, Section 4.3 on their life, both missional (beyond the church) and pastoral (within the church).
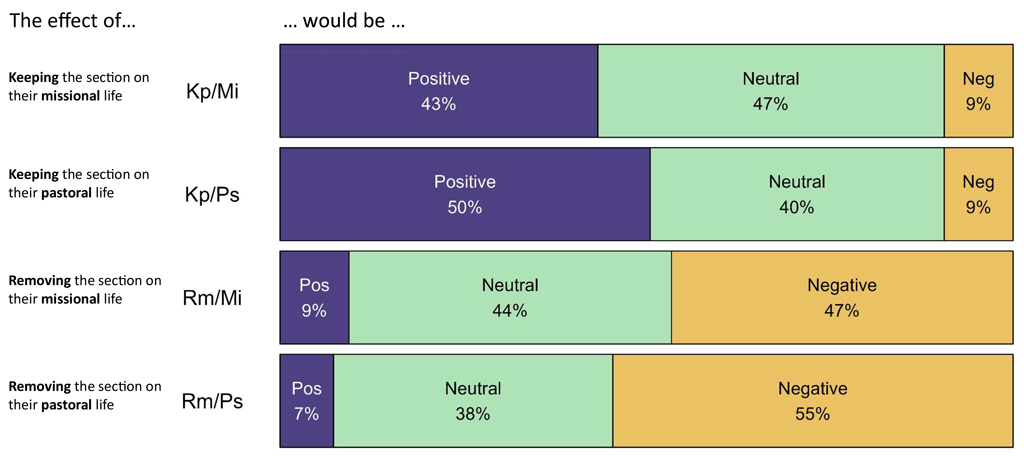
Churches felt that
keeping the bracketed section would be
positive for both their
missional (Kp/Mi: 43%) and
pastoral (Kp/Ps: 50%) life. Less than one in ten churches (9%) thought that
keeping the bracketed section would be negative for their
missional and
pastoral life. A considerable number of Churches felt that removing the bracketed section would have a
negative effect on their churches’
missional (Rm/Mi: 47%) and
pastoral (Rm/Ps: 55%) life.
Understanding the charts
We will now look in more detail at the responses. The purpose of this approach to the data is to identify what, if any, differences there are in the responses, depending on the average age of people in the church; proportion of people from GMH; the geographical or economic context of the church, and other characteristics. This information about the churches was gathered from participants at the beginning of the survey. Some of the respondents did not complete all these ‘demographic’ questions, however almost all did give this information. It is therefore useful when analysing the responses.
A note about neutrality
The neutral space in these bar charts is a place in the middle of the sliding scale between ‘very positive’ and ‘very negative’. There will be a range of reasons why churches have selected this part of the sliding scale. In some cases, it may be because they recognise some positive and some negative effects of removing or retaining the bracketed section; it may be because they are unsure of the effects; it may be that they do not think there will be a significant effect either way. There may be a variety of other reasons why they have selected the space in the middle. We will explore some of the reasons given in the comment that accompanied these questions, later in the chapter.
A note about abstentions
The abstention rate of 23% for these questions is broadly in line with that for the questions about accreditation and same-sex marriage.
There may be a variety of reasons why respondents abstained from these questions, which might include that the respondent was uncertain about possible effects of a change. However, we do not have the data to understand why respondents abstained.
Who said what?
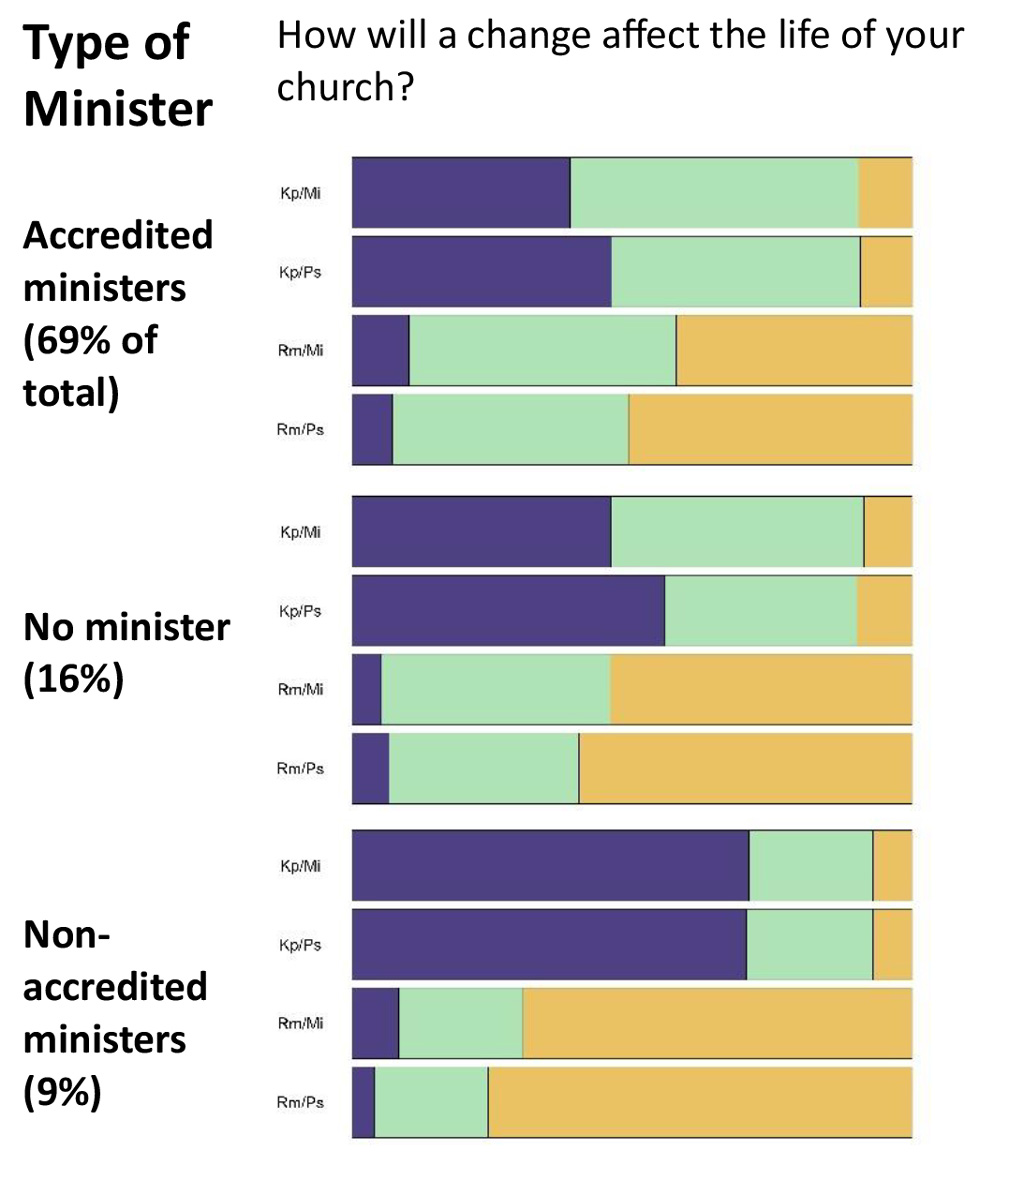
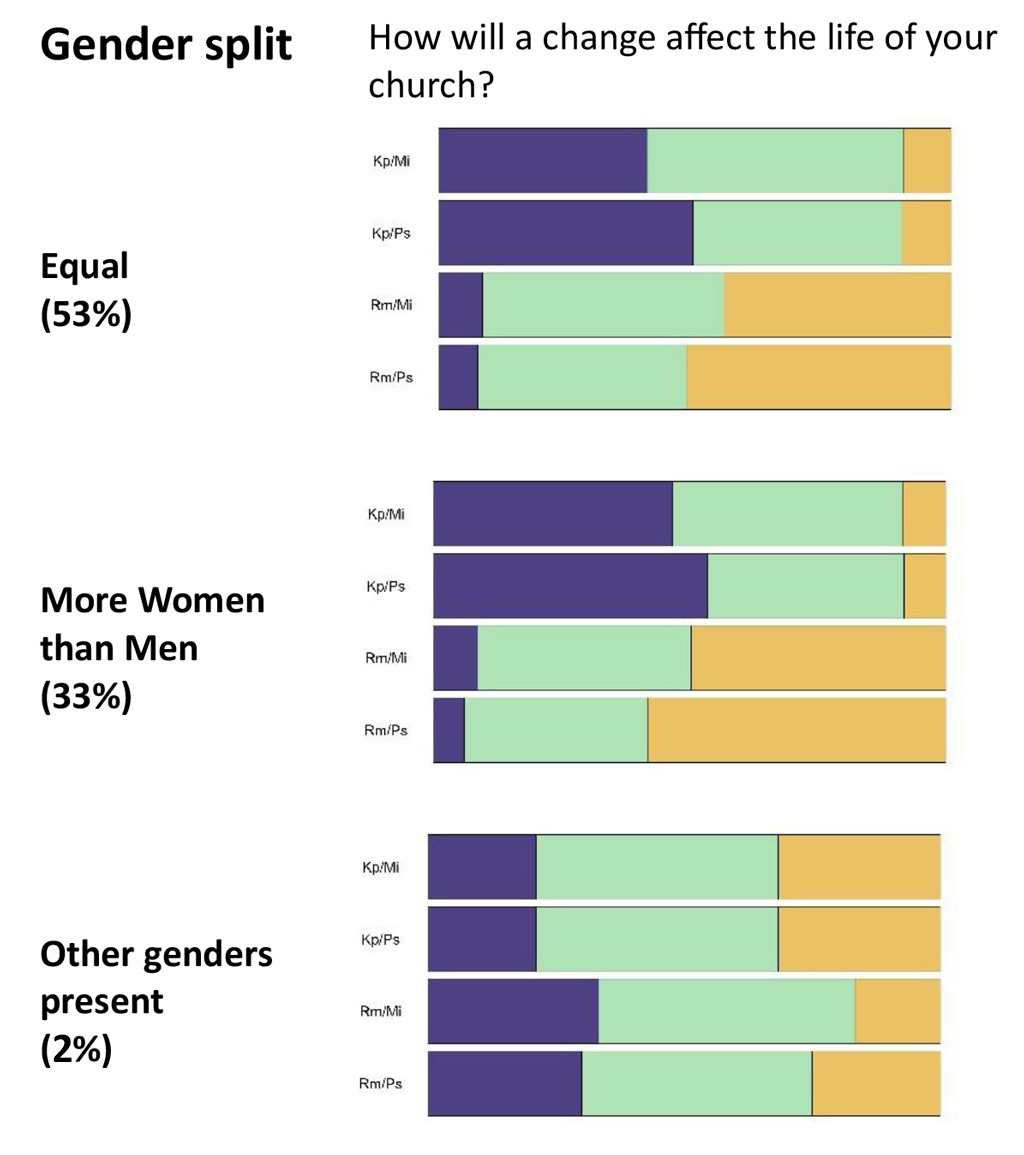
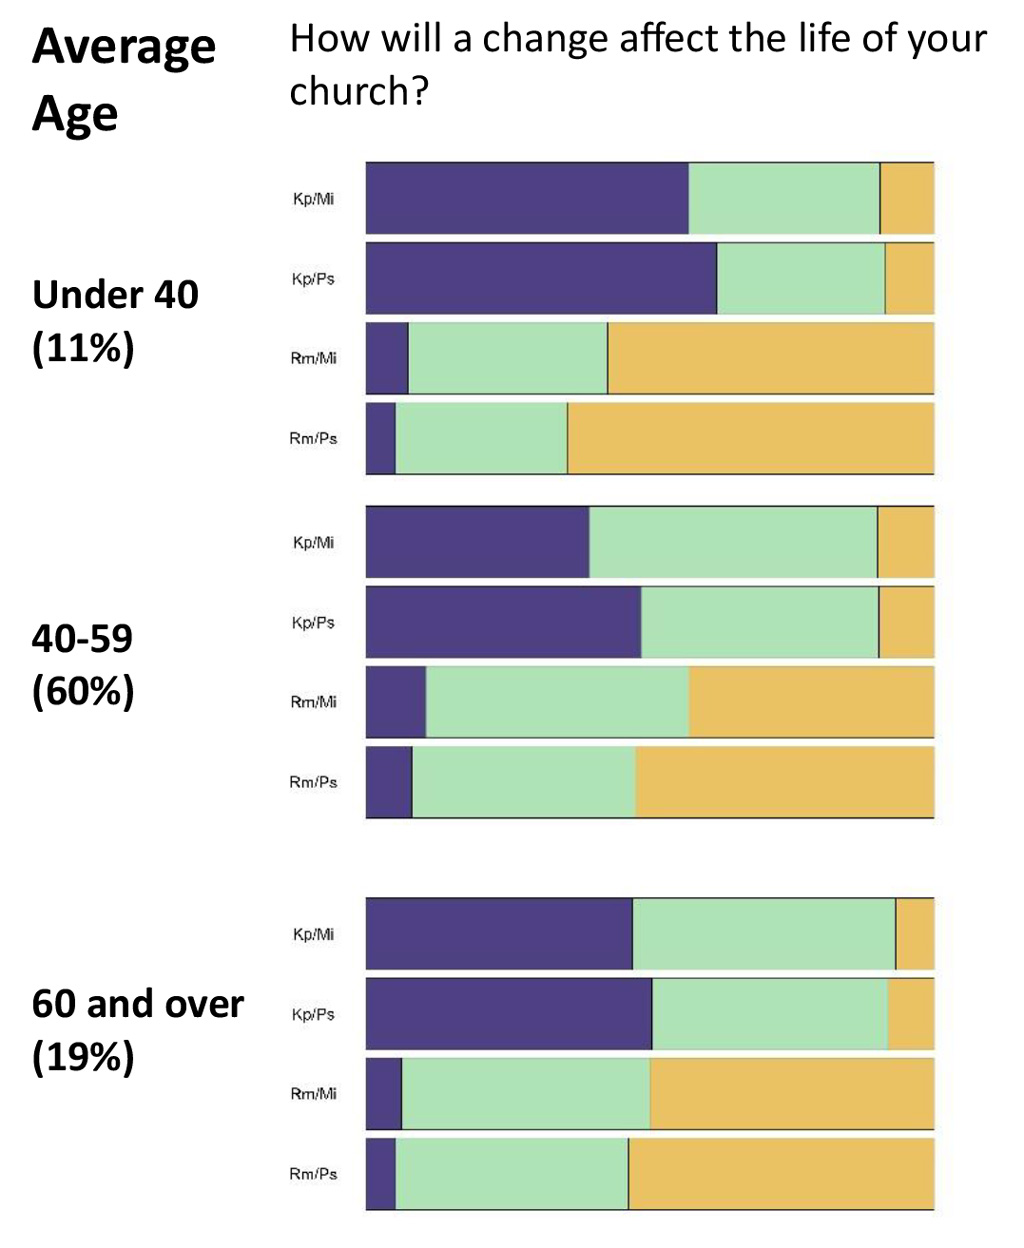
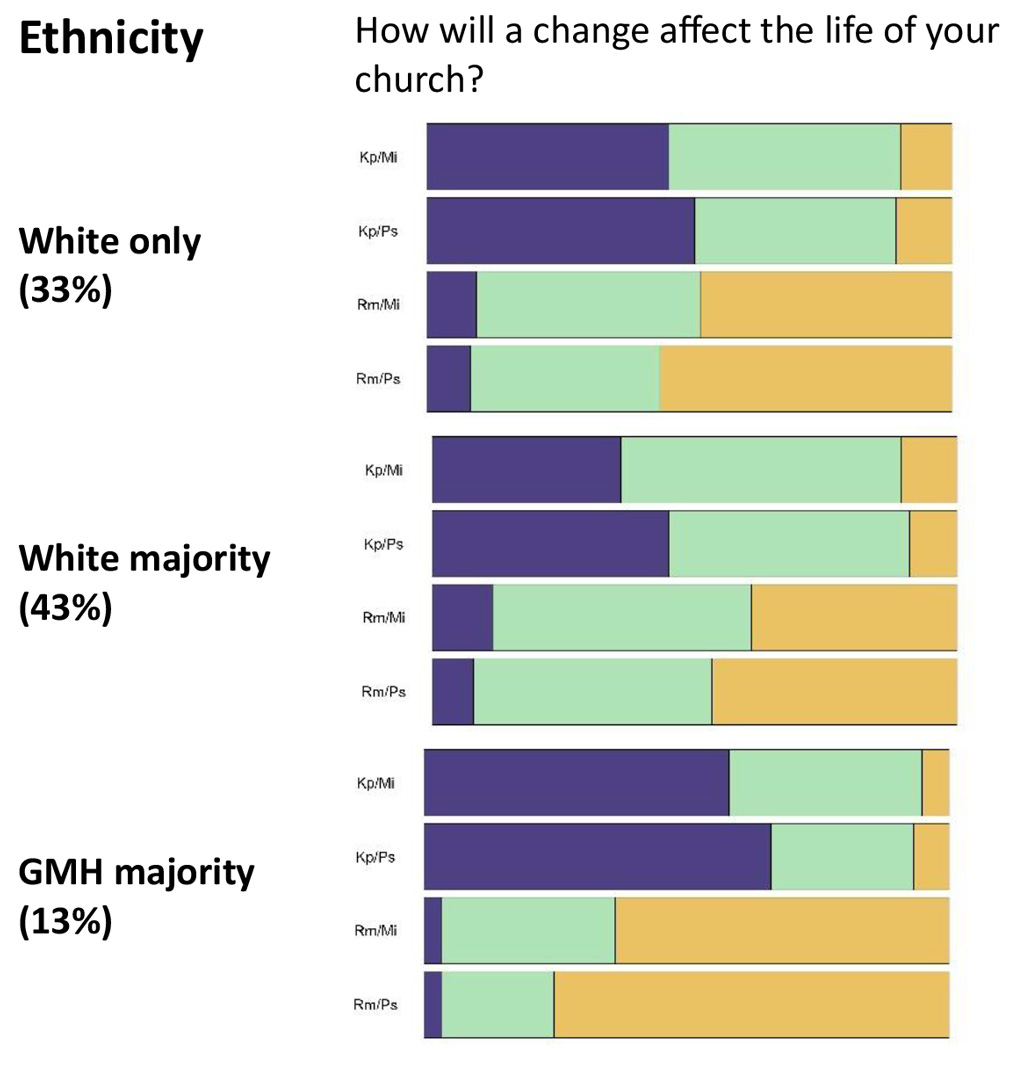
Each graph considers the effect of
Keeping (Kp) or
Removing (Rm) the bracketed section, on
Missional (Mi) and
Pastoral (Ps) life

 |
|
 |
Churches with non-accredited ministers were much more likely to think that keeping the bracketed section would be positive for their missional (71%) and pastoral (70%) life compared with churches with accredited ministers (39% and 46%).
|
|
Churches with other genders present were more likely to consider the removal of the bracketed section positive for their missional (33%) and pastoral life (30%).
|
|
|
|
|
|
|
|
|
 |
|
 |
Churches with an average age of below 40 were most likely to think that keeping the bracketed section would be positive for their missional (57%) and pastoral life (62%) in comparison with churches with an average age of between 40 and 59 (39%, 48%).
|
|
Churches with a majority of people of Global Majority Heritage were most likely to see keeping the bracketed section as positive for their missional (58%) and pastoral life (66%) of the church. Churches with a majority of white people were less likely to see it as positive (36%, 45%) |
|
|
|
|
|
|
|
|
There is little difference between the churches in the most and average deprived areas, while those in least deprived areas are a little less likely to see keeping the bracketed section as positive for their missional (37%) and pastoral life (49%). |
|
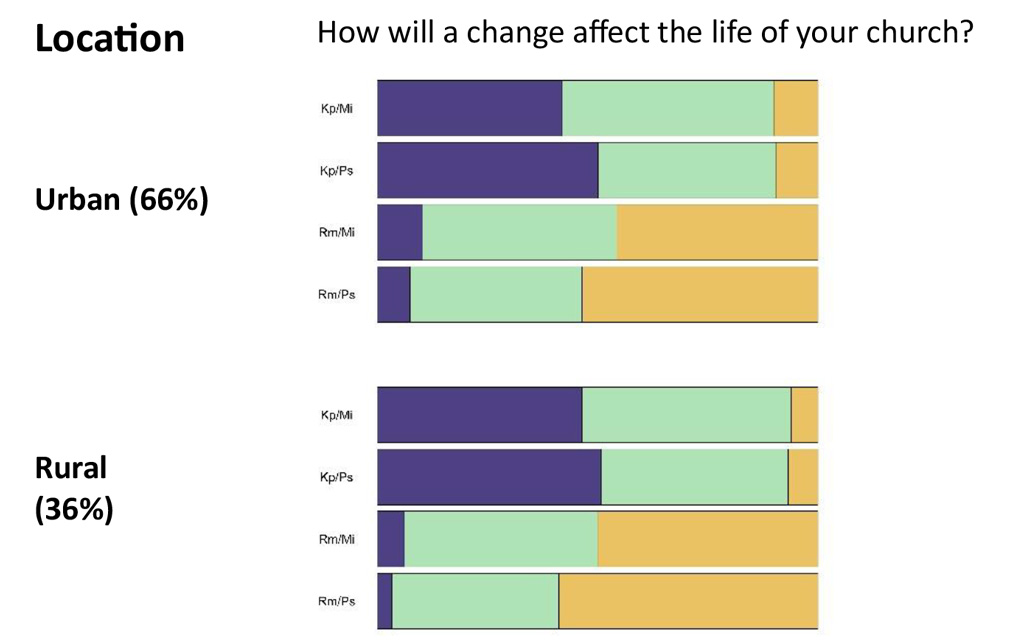
There is little difference between churches in urban and rural areas in terms of the effects on their missional and pastoral life. Urban churches are slightly less likely to think that keeping the bracketed section is positive for their missional life (42%) in comparison with rural churches (46%), but figures for their pastoral life are similar (50%; 51%)
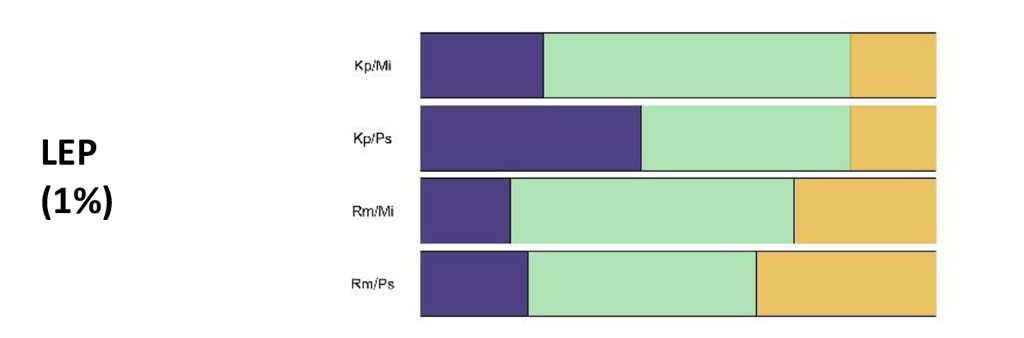
Churches in Local Ecumenical Partnerships are less positive about the effect of keeping the bracketed section on their missional (24%) and pastoral (43%) life. |
|
|
|
|
|
|
|
|
 |
|
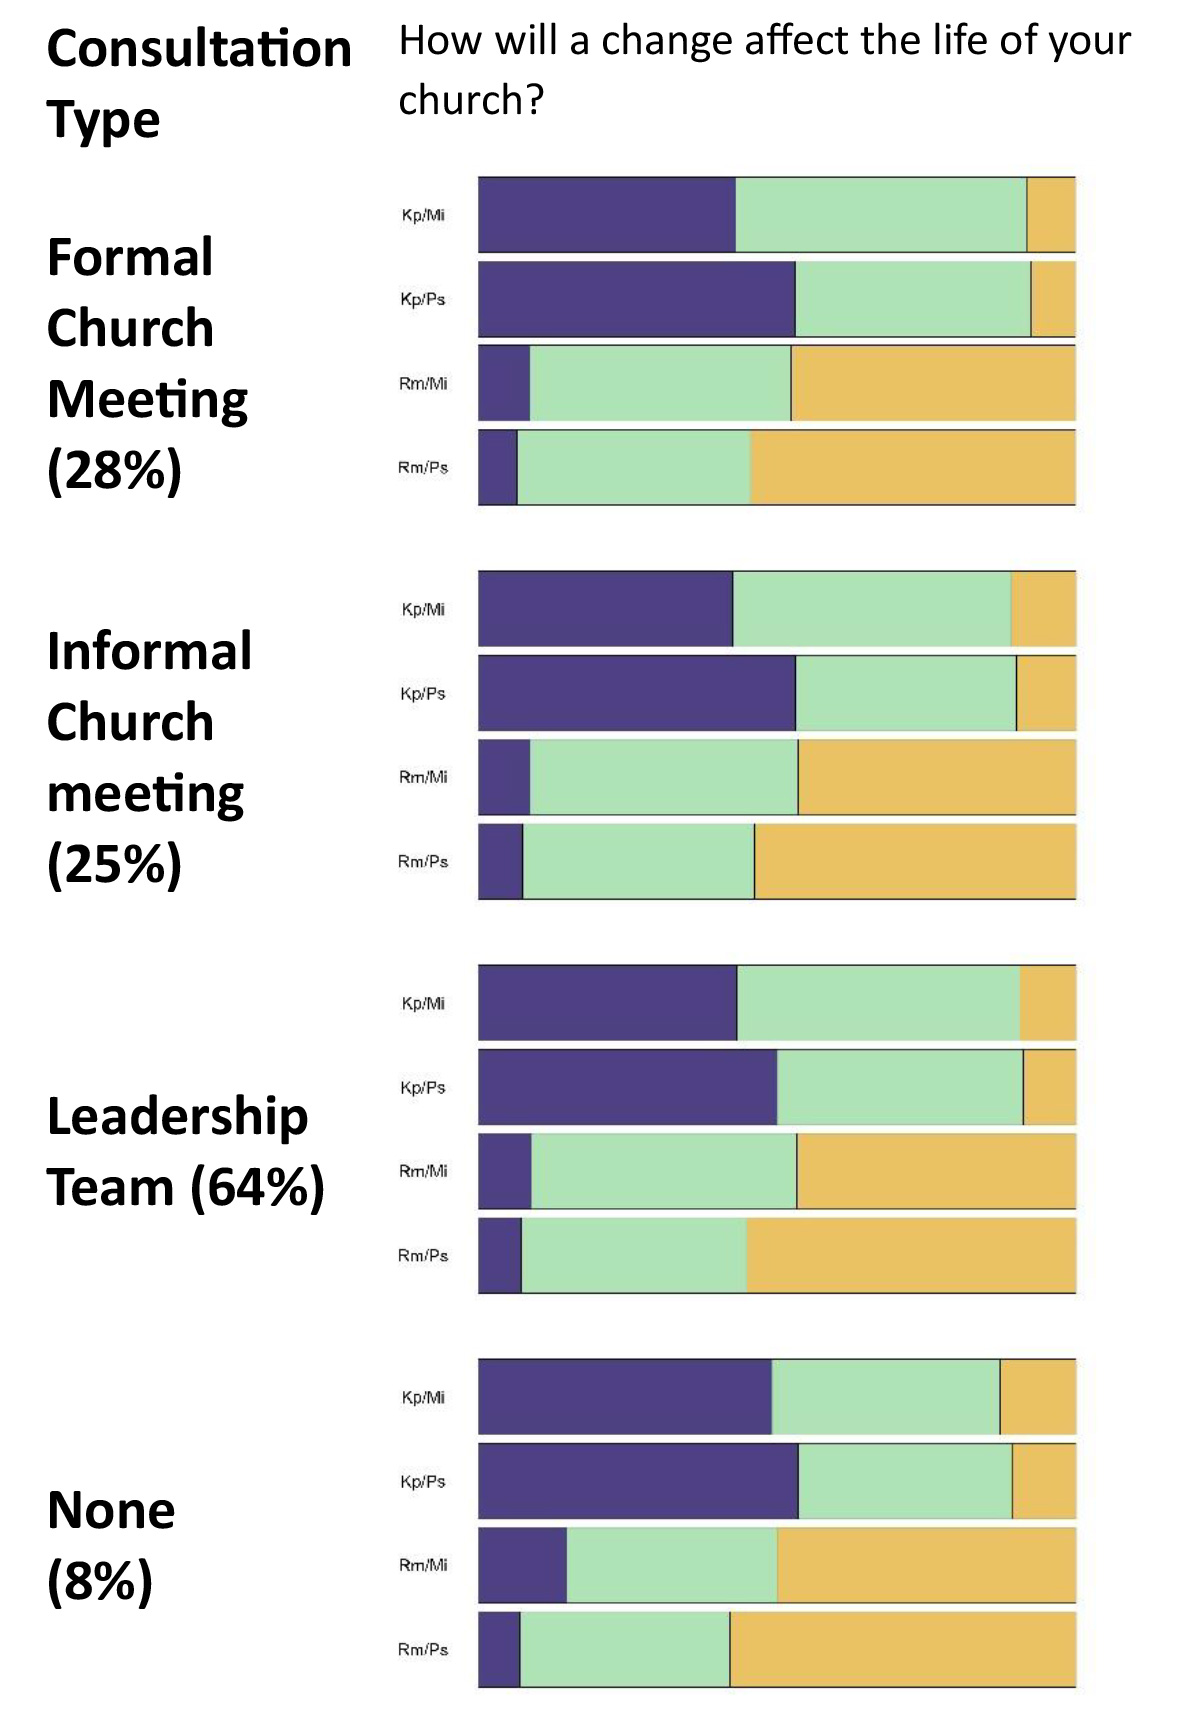 |
There is little difference in the figures for churches of different sizes, or who used different consultation methods.
|
|
|
Headlines from the charts
Notably more churches said that
keeping the bracketed section would have a positive effect on their missional and pastoral ministry than churches that said
keeping the brackets would have a negative effect. This view of a positive effect of
keeping the brackets is demonstrated in the data whichever ‘demographic’ characteristics is used to analyse the responses to these four questions. The one exception is for churches with some people in the church identifying as ‘other genders’. More of these churches said
keeping the brackets would have a negative effect rather than a positive effecton the missional and pastoral life of the church.
There are three categories in which the percentage that say
keeping the brackets would have a positive effect on both missional and pastoral ministry of the church, is highest:
-
Churches with non-accredited ministers where keeping the bracketed section would be positive for the missional (71%) and pastoral (70%) life of their church. This is in contrast to churches with an accredited minister or looking for an accredited minister who felt that keeping the bracketed section would be less likely to have a positive effect on the missional (39%) and on the pastoral (46%) life of the church.
-
Churches with a GMH majority where keeping the bracketed section would have a positive effect on the church’s missional (58%) and pastoral (66%) life.
-
Churches with an average age of under 40 who felt that keeping the bracketed section have a positive effect on missional (57%) and pastoral (65%).
These are the same three characteristics who are most likely to say ‘no’ to an accredited minister being in a same-sex marriage and to staying in BUGB with those who have a different view.
Following the questions about the effect of removing or keeping the bracketed section respondents were invited to give their thoughts and comments. Here are some of the reasons why people responded as they did to these questions, taken from their comments.
Pastoral effects:
-
Some expressed concern about the negative effect of removing the bracketed section on the pastoral and missional life of the church. This included causing confusion, particularly regarding how to read the Bible.
“We feel that introducing this change would cause concern, confusion, division and uncertainty – leading to increased pastoral needs. The confusion would arise because people would be left questioning the value of the Bible and how to interpret and apply it”
“I think that the congregation would feel very confused and start to question other commands and guidance in the Bible, especially as we don’t have a minister to help us.”
-
Others expressed a feeling that the change would cause them to consider their relationship with BUGB.
“We have women leaders … If the BU adopts this change we can see no other denomination that we could be a part of except those who forbid women teachers.”
”If BUGB were to approve of same-sex marriage we would leave the Union. This would be very sad.”
-
Some expressed concern for members of the church who are or who know people in their family who are LBGTIQA+.
“Some parents will feel let down as they try to grapple with issues in their family and help their children relate well with friends at school without compromising their beliefs.”
“This is a very sensitive subject for a small number of long-standing members who have chosen to remain celibate and we are very conscious of the trauma any change in the current rule might cause to them, their families and the church family, their discipleship and mission.”
-
Some expressed positive effects on the pastoral life of the church of removing the bracketed section:
“We are aware of some exceptionally gifted Baptist ministers and MIT [Minister in Training] who have been forced to leave Baptists Together as it is not safe for them to marry and love.”
[At a church discussion as part of the consultation] “several people explained that their understanding of these matters has widened as a result of single-sex relationship within their family or among their friends, which has led us to a generous and more inclusive approach within the church.”
Missional effects:
-
The primary concern in the comments was about how the Bible is read and how people outside the church would perceive the church.
“I think our folk would feel that it would be difficult to portray ourselves as a firmly Bible-based denomination if the section in brackets were to be removed.”
“… we believe that scripture is clear on the subject of marriage. It [removing the bracketed section] would have the potential to bring confusion among us and for our new believers.”
“For sure retaining the bracketed section would put us at odds with society, but isn’t that where we are supposed to be counter cultural?”
“We would be an object of ridicule in our village if we had a practicing homosexual minister.”
“Retaining the brackets would give clarity about our position and this would be helpful for moving forward with our mission.”
-
Some comments talked about how a change would affect the church’s welcome:
“The church fully supports removing the section in brackets as it feels that people of all backgrounds should feel welcome and supported in the church.”
[Removing the bracketed section] “could well make LGB people feel less unwelcome than they do currently.”
A note about the neutral responses
It is worth noting that the percentage of respondents who chose a neutral response (in the middle of the sliding scale) are considerable in almost all the responses in this chapter, between 30 and 50%, more often than not between 40 and 50%. As discussed elsewhere in this Report, the neutral response may have been chosen for a variety of reasons. The church may feel that there will be little effect on their missional and/or pastoral life; they may be unsure what effect there might be; there may be other reasons. The data in the comments does not give any clear indication about why the neutral response was given.
If you want to look at the
survey data in detail, it is available in the Appendices.
In the next chapter we will present the responses from the
Ministers and Regional Ministers’ Survey. Then we will present the responses from the
Baptist Assembly Listening Space. This is followed by a
chapter exploring three themes; things we have heard again and again, that have emerged in all that we have heard during the Consultation.
Return to top of page